Disclosure: This post may contain affiliate links. If you click on a link I may make a small commission at no extra cost to you. You can read the full disclosure here.
Last Updated on October 23, 2022 by Chris Panteli
AirDNA Review
When you’re setting the pricing for your Airbnb, do you get stuck trying to figure out the best rates? You can look up other properties in your area, but when they’re all using different price points, it’s tough knowing how to stay competitive while maximizing your revenue.
Without concrete data on local pricing and occupancy trends for vacation rentals in your area, you’ll likely miss the mark on your pricing structure and may miss out on bookings.
AirDNA is a market analytics tool that takes the guesswork out of pricing. In this AirDNA review we’ll show you how this tool works, the pros and cons, pricing, and how you can use it to improve your Airbnb occupancy rate.
Looking for a way to manage your Airbnb listing through your phone? Check out our full review of the Your Porter App (Now Guesty) to see if it’s worth downloading.
What is AirDNA?
AirDNA is an analytics tool that shows data on vacation rentals. It was founded by Scott Shatford for Airbnb hosts, property managers, and investors, who can use the tool to get data on lodging prices, occupancy rates, and seasonality trends.

AirDNA gathers this data through scraping and partners. Every day, their servers scrape sites like Airbnb to collect data from listings in the United States and around the world. AirDNA has data on over 35,000 properties (Airbnb has around 4 million hosts) and can tell you everything from calendar pricing to cancellation policies.
It’s totally legal, and AirDNA has relationships with booking platforms such as Airbnb and Vrbo.
AirDNA Pros & Cons
Let’s take a look at the pros and cons of AirDNA first, so you can figure out if it’s the right tool for your Airbnb rental business.
✅ PRO: Fast analysis
All of the data used by AirDNA is freely available, so you could theoretically do the analysis yourself. The advantage of using a tool like this is the speed of the reports. AirDNA analyses all of the properties in a specific area and generates reports that you can use to quickly spot trends.
✅ PRO: Suss out the competition
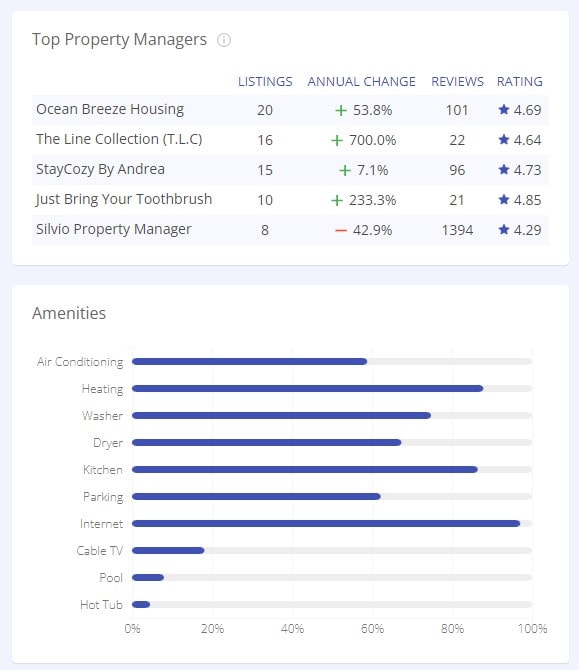
One of the key ways owners use AirDNA is to compare their property to the local competition. You’ll be able to see which properties are doing the best in your area and compare your stats to other hosts. You can change your pricing and policies accordingly, and use it as a tool to get ahead of the super hosts in your city.

✅ PRO: Streamline pricing
As an Airbnb owner, you need to know what other hosts in your area are charging. If they’ve been steadily increasing their prices over the past few years, you could be doing the same. AirDNA allows you to keep an eye on pricing in your area and make sure you’re in line with the competition.
✅ PRO: Assess investments
If you are looking to invest in a new Airbnb or want to start renting out your home, data analytics tools like AirDNA are a must. You can’t invest in a property if you don’t know how much money it makes. AirDNA lets you check the occupancy rates, nightly prices, and trends over time. You can also compare investments in the same area to choose the best one.
❌ CON: No in-depth future modeling
AirDNA is great for showing what is currently happening in the property market, but it doesn’t give you any future trends. A property that’s doing well now might actually be in slow decline, so future trends are also important, especially when looking to invest.
❌ CON: Doesn’t account for multiple rooms
If there is a large hotel or house that rents out single rooms, AirDNA will assume the entire property was rented out every time. For example, if you have a competitor with a 10-bed house who rents out single rooms, their data is going to be skewed because AirDNA will report revenue for the entire house for every booking. It’s best to keep this in mind when looking at the data.
❌ CON: Monthly updates
You don’t get real-time data with AirDNA because the software updates monthly. This is fine if you’re using it for long-term trends, but if you’re an investor looking for real-time data, it could be a month out.
AirDNA Pricing
AirDNA has a free version that gives you limited access to Market Minder (one of the main tools). You won’t be able to see exact pricing details or the market grade of properties, but it will give you a general snapshot of trends in wider areas.
For full access, AirDNA works on a sliding scale based on the number of rentals in your market area. For example, a small town with under 100 hosts will cost $19.95 a month. However, if you live in a large city with over 1000 hosts, you’ll pay $99.95 a month.
There’s also an enterprise account for hosts with multiple properties that costs $299.95 a month.
For investors, you’ll need the Investment Explorer option, which is $199 a month. This gives you access to nationwide information.
AirDNA Features
There are two main features of AirDNA:
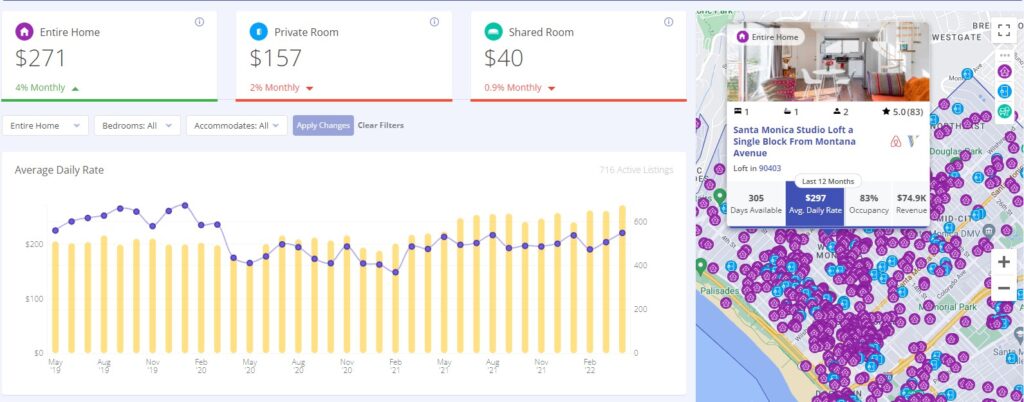
- MarketMinder: This is the analytics software that shows you data on competitor rentals. It produces easy-to-understand graphs and reports so you can carry out better market research.
- Investment Explorer: This is for people looking to invest in new rental properties. You’ll get marketing data as well as home value information on over 750,000 properties in the US to help you find the most profitable investments.
Overall, AirDNA is a comprehensive analytics tool that gives detailed information for hosts and investors, including:
- The number of Airbnb hosts in your area.
- Average daily rate for rentals in your area.
- Changes and trends in the average daily rate.
- Occupancy rates.
- Seasonality information.
- Regulatory and policy information.
- Revenue details, including annual revenue.
How do you use AirDNA?
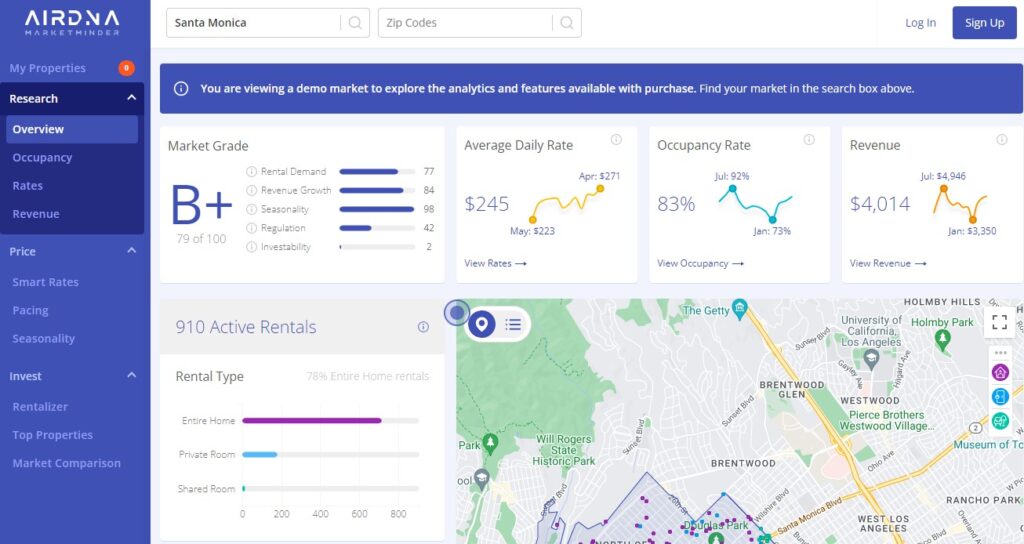
For investors, the easiest and quickest way to use AirDNA is by looking at the Market Grade of a location. Each area is assigned a grade from A to F and is broken down into four key criteria: rental property demand, revenue growth, seasonality, and regulation.
- A high demand score means a lot of people are traveling to that area and looking for a short-term rental.
- A high revenue growth score means the revenue of the properties in that area is increasing.
- A high seasonality score means the changes between high and low seasonality are minimal, so you won’t have long periods with no revenue.
- A high regulation score means there is low regulation for Airbnbs in the area.

As an Airbnb host or vocational rental property manager, you can narrow down the search to your area, and then get easy-to-read graphics for different metrics, including:
- Average Daily Rate
- Occupancy
- Revenue
- Demand Growth
- Active Listings
All of this information can then be used to update your pricing, policies, and marketing, to make sure you’re making the most possible on your listing.
Who is AirDNA for?
AirDNA is a great tool for Airbnb property owners, property managers, and potential investors. With the amount of information you get on market intelligence, pricing, and revenue management, it’s a useful tool for anyone in the Airbnb market.
What is the difference between Airbnb and AirDNA?
The names are similar, so it can get confusing. Airbnb is the host platform where you list your property. Here, people can book your property and it’s where you’ll manage bookings, take payments, and message guests.
AirDNA is a marketing tool used to improve your Airbnb active listing. Although AirDNA doesn’t integrate with Airbnb, it gives you information about your competition, so you can make informed decisions about your pricing and investments.
What is a good AirDNA score?
Each market on AirDNA is given a Demand Score that ranges from 1 to 10. This score is tied to the occupancy rate; a score of 1 means low occupancy (low demand) and a score of 10 is high occupancy (high demand).
A score of 5 is average, and anything above a 7 is considered a good score. Don’t worry about remembering the values though, each score has a word next to it to remind you what the score means (e.g., 10 – good; 5 – average; 1 – low, etc.)
How accurate is AirDNA?
AirDNA uses data scraping to collate information, which means it’s very accurate. However, AirDNA bases much of its analysis on factors like the number of bedrooms, location, etc. It doesn’t factor in reviews, photos, or local amenities, and we know that these factors also contribute to the success or failure of an Airbnb.
We’ve also already touched on the issue of properties with multiple rooms to let. If a ten-room property gets booked on Airbnb, AirDNA will assume the entire house was booked, whereas in reality, perhaps only one room was booked. This can skew the analysis of that property and throw off averages.
Overall, AirDNA is very accurate, but it’s especially important to do more detailed research if you’re an investor looking at potential properties.
How do you analyze AirDNA?
Just like other Airbnb management tools (Price Labs, Wheelhouse, etc.), all of the data on AirDNA is presented in graphs and downloadable reports. You’ll be able to look at graphs of market trends, revenue, etc., and see the trends in your area. There is also the option for expert account management on the platform if you want help making use of the data and tools.

Is AirDNA worth it?
Many Airbnb hosts can’t live without AirDNA, and the insights it gives into the local competition are invaluable when planning pricing and writing policies. However, it’s down to you as a host whether or not you’ll find this tool useful.
If you use a vacation rental management system that already has dynamic pricing, then you’ll probably get little value out of AirDNA. On the other hand, if you’re looking for potential investment opportunities, it’s a must-have.
Try out the free version first and see if you get value from the insights. But before you commit, make sure to check out our Host Tools review to see if this is a better tool for your Airbnb.


